Data analysis
Quantification is the passage that transforms a set of NMR spectra into a data matrix. This task can be performed following two complementary routes: either by resolving the signal forest assigning each (or most) of them to the proper metabolite – this implies that we “a priori” assume to know which molecule can be present in the mixture – and measuring the intensities of the specific peaks of interest (targeted analysis), or by processing the spectra “as they are” regardless to any other consideration and relying on the correlation structures embedded in the 1H 1D spectrum due to its intrinsic redundancy (pattern recognition).
This latter strategy is performed on the whole set of spectra at once and requires a series of automatic, or semi-automatic steps that can include peak alignment and then discretization by subdividing the spectral range in small fractions (bucketing or binning). The result is a data matrix that embeds all the information included in the spectra, but whose variables (spectral intervals) do not have a direct metabolic meaning: multivariate data analysis is then applied for variable reduction to unravel the structural and metabolic relationships subtended by the spectra.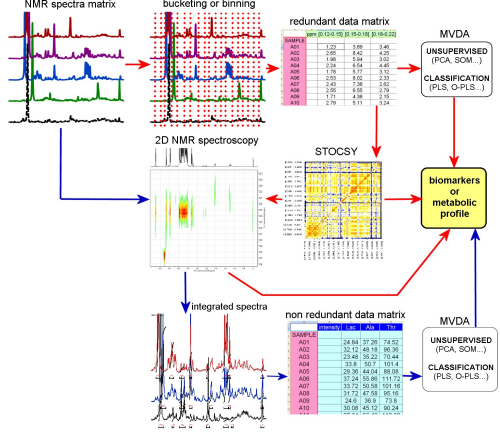
Both targeted analysis and pattern recognition method require the assignment of the resonance signals to their source metabolites in work flow. This procedure needs the operator's skill, that can be based on a large set of 2D NMR techniques, (bidimensional homonuclear spectroscopy, like COrrelation SpectroscopY (COSY) and TOtal Correlation SpectroscopY (TOCSY) experiments or bidimensional heteronuclear spectroscopy like Heteronuclear Single Quantum Coherence (HSQC) or heteronuclear Multiple Bond Correlation (HMBC)), on reference spectra, on literature data.
One more available tool is given by Statistical Total Correlation Spectroscopy (STOCSY): variables from the unsupervised matrix are correlated pairwise and the correlation coefficients are arranged in a correlation matrix. The strongest correlations are due to signals belonging to the same molecules.
The variables of the data matrix yielded by supervised analysis are the real concentrations of the detected metabolites, and the application of multivariate methods can directly lead to the understanding of the metabolic system under study.
Both the targeted analysis and the pattern recognition method contribute to provide the metabolic profiles of the system and to detect the biomarkers that characterize the biological processes occurring in it.
After these steps, multivariate techniques are applied for detection – in a unsupervised way to pick out intrinsic correlations in the data field and/or the presence of outliers (commonly by Principal Component Analysis, PCA, as first) or else supervised against known external variables (like with Partial Least Squares Analysis, PLS, Orthogonal-PLS, Multiple Correspondence Analysis, MCA) or for classification (PLS, SIMCA, multiway analysis etc.)